

Fall has arrived, and for many nonprofits and associations, it’s time to start planning annual reports. While annual reports are a great way to communicate – and illustrate – impact, it can feel overwhelming to decide what to highlight and how to tell your organization’s story.
Over the course of the last three decades, GRAPHEK has worked with association and nonprofit partners to transform annual reports into strategic communications that reinforce member value, build stakeholder confidence, and, where appropriate, support fundraising and non-dues revenue. We view our role as two-fold: yes, we focus on the design to establish a clear hierarchy, create multiple entry points into the content, and make the report inviting for both readers and skimmers. But we also work with our clients long before the design stage, to create a meaningful look at who benefited from their work, what changed, and why their work matters.
At GRAPHEK, we enter every impact report partnership with the philosophy that content and design are inseparable: Strong design cannot compensate for content that lacks focus, and compelling content can lose its impact if readers cannot easily navigate or absorb it. We workshop with clients through a series of questions, including, for example:
- What is your industry’s climate right now? Is there anything we should be sensitive to?
- Where can personal stories make the data more meaningful?
- What do you want a reader to remember?
- What should readers be inspired to do next?
- How will the annual report be used throughout the year?
As we consider the evolution of our storytelling through impact reports, we look to our very first client – Asian Americans Advancing Justice | AAJC (Advancing Justice | AAJC) – with whom we’ve partnered for 29 years. In the early 2000s, we began designing their annual reports.
“Our intention for our annual report is to build trust and accountability with the constituents who care about our work,” said Marie Nguyen, director of development. “It’s a strong fundraising tool and provides the evidence for your next ask – it signals governance and financial transparency. The process of putting it together is also a good exercise for our staff, since it pushes them to think strategically about their work and its impact. The result is greater fluency about what we do, which – in human and civil rights – it is critical to our mission.”
“We’re an advocacy organization, so writing content is an incredible opportunity to translate complex policy and legal processes into a digestible format for the average person,” she added. “When we turn wonky policy into plain language, we bring a lot more people into the conversation.”
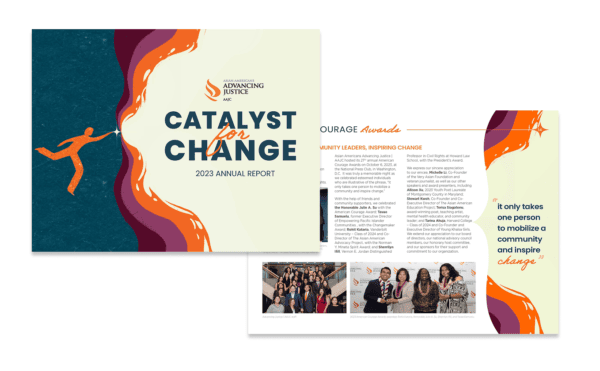
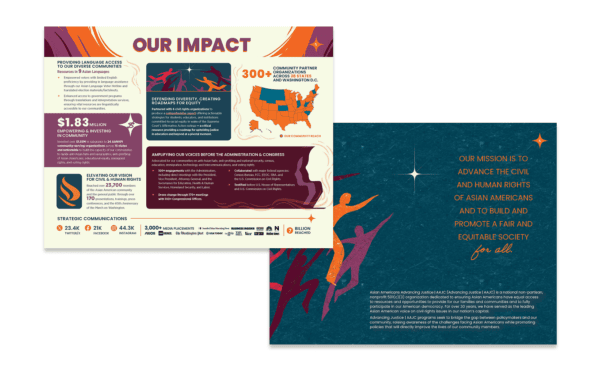
Over time, Advancing Justice | AAJC annual reports have become more strategic, editorial, and audience-focused.
“Earlier reports were more linear and text-driven,” remembers Ellen Kim, GRAPHEK’s founder and creative director. “Today, we think intentionally about narrative structure, pacing, visual entry points, emotional connection, and the relationship between stories and data. We look for opportunities to lead with a theme and a compelling human story and then reinforce it with statistics, outcomes, and additional evidence that build credibility. We also stay away from stock photography – instead, we use real photos and custom illustrations.
“Technology has also expanded what an annual report can become. In addition to print, we now consider digital reading behaviors, accessibility, interactive content, and how stories, statistics, infographics, and visuals can be repurposed across websites, presentations, social media, fundraising appeals, and other year-round communications. Despite that evolution, the guiding principle has remained the same: design should clarify and amplify AAJC’s work without distracting from it.”
“Working with the GRAPHEK team,” Nguyen agreed, “helps us create inviting content from what would otherwise be very dense reporting, and I’m proud of that. For example, our technique for highlighting the details of a legal case, in a section called ‘In the Courts,’ is really effective — those items appear in a purple callout box with an icon of the scales of justice on every page. It makes it incredibly easy for a reader to familiarize themselves with what to expect and where to find it.”
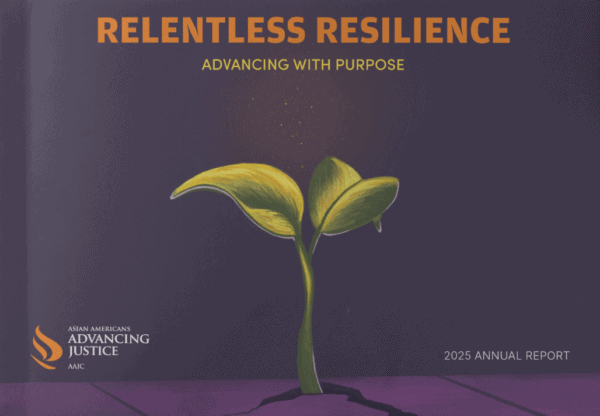
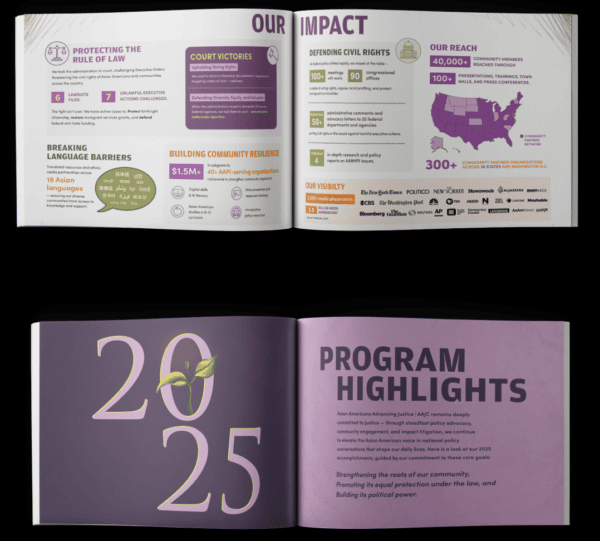
Communicating the complexity of a client’s work is a common challenge, and our use of human-centered photography, impact statistics, personal stories, testimonials, and program highlights are all balanced in order to provide give readers multiple ways to engage with the content. Someone may read the report from beginning to end, while another person may spend only a few minutes scanning the headlines, images, statistics, and major accomplishments. The design needs to serve both audiences.
“We’re also always cognizant of the details; if we say we helped pass a bill, we can’t just leave it there,” Nguyen said. “Does anyone really understand the amount of effort it takes to pass a bill? So, in order to talk effectively about advocacy, for example, we ask our staff – all year long – to track their engagements, so that we can illustrate that we met with congressional offices over 200 times. It puts it all into context – and means you have to plan well ahead.
“Social media has also changed everything,” she added. “We don’t need to include everything, but we do need to share the top-line efforts and find a way to engage people. GRAPHEK has been enormously helpful, both in terms of what content will reach people, and how design can help make something visually inviting. Colors, fonts, callout quotes, graphics, and even just rule lines to help guide your eyes … they’re great at it.
“We’ve gone from print only to almost entirely digital during the pandemic, and now we’re swinging back toward having print options available too. It’s incredibly freeing to be able to include links in the digital form, giving readers the ability to dig deeper if they want to. Still, having a print version is great for sharing at events or to leave on registration tables where we might meet and engage new supporters. Or, if I’m meeting with a prospective donor or funder, leaving behind a report to provide more depth to anything we discussed is a huge benefit. And, a QR code on the back page can easily bring a reader to the full digital version, and in seconds they have full access to all of our resources.”
Ultimately, an annual report is an opportunity to flex. Share your story, celebrate your successes, help readers understand how they can help you advance your mission, and build equity for your organization! Let’s get started!
A Recipe for Success: Letting Your Annual Report Make an Impact
The strongest annual reports don’t simply document the past. They combine storytelling, compelling data, and thoughtful design to demonstrate impact, build trust, and inspire continued engagement and support throughout the year.
- Lead with impact rather than activity.
- Connect human stories with meaningful data.
- Give readers several ways to enter and understand the content.
- Use charts and infographics to clarify information, not simply decorate a page.
- Balance institutional achievements with the experiences of real people and communities.
- Use clear space and changes in pacing to avoid overwhelming the reader.
- Integrate financials, donor recognition, and calls to action into the larger story.
- Design for accessibility, readability, and both print and digital use.
- Understand the full volume and hierarchy of the content before beginning the design.